U might wonder how fft is performed using python or any using any language
the concept here is to explain the fft in detail with example
u can run the code in python using colab or copy the code below to run in your local m/c.
Consider a sample of data that has N data points against time
the fft for the data points will give you the amplitude for the data points
which could a complex number
again what is a complex number (a+ib)
i*i = -1
again why this complexity don't worry too much we will talk about this in detail.
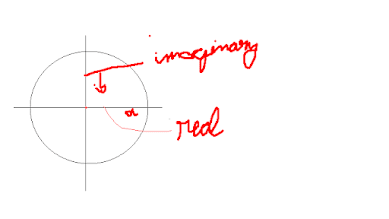
consider
a - to be the x axis (real)
ib - y axis (Imaginary)
in the same way calculate till f(N-1) ,run the code below to cross check the values.
result -
f(0) = (-1.1102230246251565e-16+0j)
f(1) = (5.551115123125783e-16-3.9996979771955568j)
f(2) = (-1.410503594010501e-16+2.220446049250313e-16j)
f(3)= 0.00030202280444291407j
f(4) = 2.0280150993880174e-16j
f(5) = (1.3322676295501878e-15-0.0003020228044421369j)
f(6) = (2.4561914808967368e-15+7.771561172376096e-16j)
f(7)=  (-2.9976021664879227e-15+3.999697977195556j)
all these are complex numbers dont worry
amplitude can be calculated using the formula
amplitude = sqrt(a^2+ib^2)
The frequency is tipped at f(1) and f(7) giving as the frequency of the signal as 1Hz
this way we can do a fft for mix of sin signals to separate various frequencies
and do a data manipulation such as filtering certain frequencies
which are considered as noise.
enjoy fft with python.
https://github.com/naveez-alagarsamy/matplotlib/blob/main/Fourier_basics.ipynb
python code -
import math
import numpy as np
import matplotlib.pyplot as plt

print(math.e**(np.pi/4*1j))

#loop through the samples -use size
# euler's formula   ---- e^i*x  = cosx +isinx

#fft - theta= 2pikn/N

# k - 0---N-1
#n- loop for all samples
#N - total no of samples

#fft [k] = summation (0---N-1)[x[k]*e^(-i*theta)]
# fft [k] = summation (0---N-1)[x[k]* (cos(theta) -i*sin(theta))

x = [0, 0.707, 1, 0.707, 0, -0.707, -1, -0.707]
N = len(x)

def calculate_theta(k, n , N):
  theta = (2*np.pi*k*n)/N
  return theta

def calculate_eulerfor_theta(theta):
  #print(math.e**(theta * -1j))
  euler = math.e**(theta * -1j)
  return euler

x_n_fft = []

for i in range(N):
  #print(i)

  x_n=0
  for j in range(N):
    thetas = calculate_theta(i, j, N)
    eulers = calculate_eulerfor_theta(thetas)
    x_n += x[j]* eulers
  print(round(abs(x_n)))
  x_n_fft = np.append(x_n_fft, round(abs(x_n)))
print(x_n_fft)


#plot the frequency domain graph
#x - axis  -  freq
#y - axis  - amplitude

#Amplitude is the magnitude from FFT --x_n_fft values
#angular frquency = [2pi*n/sample_interval * N ]
#sample_interval = [2pi/N]

sample_interval = (2*np.pi)/N
angular_frequencys = []
for angular_frequency_fft in range(4):
  angular_frequency = (2*np.pi*angular_frequency_fft/(sample_interval*N))
  angular_frequencys.append(angular_frequency)

print(angular_frequencys)

plt.plot(angular_frequencys, x_n_fft[0:4])
plt.show()

# u might wonder why i used 4 in range rather than N
#the values start repeating after N/2
# u can use N and verify


Comments
Post a Comment